I’ve got a partial metal box made for the power supply and the LED drivers. This will also have relay to control the safe lights, and an additional power outlet that’s on opposite the safe lights. So this could also be used to drive a traditional enlarger. The box isn’t anything to look at right now, but once I make a top it’ll be electrically safe. I’ll post some pictures after it’s a bit more complete. At least it now holds all the parts together which allows me to test the system out.
I made some code changes to support calibration of different papers. I started with the idea of calibrating to the traditional paper grades, 00, 0, 1, 2, 3, 4, and 5; but there are really no standards for theses. And since they cover a range of contrasts it made programming the system rather confusing. So I settled on using the ISO system. This is easily measured using a simple densitometer and graph paper. It’s also fully supported by the BTZS Plotter app, which I use for testing.
The Variable Contrast Printing Manual by Stephen G. Anchell gives a good overview of how this works.
Papers will be eventually read off of an SD card, but for now I’ve been programming a default paper.
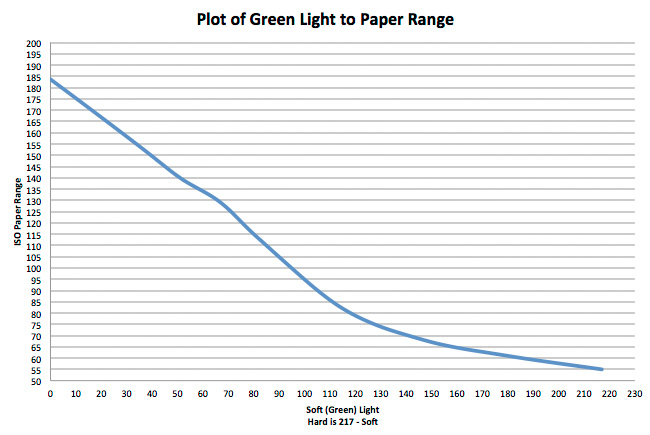
For testing I started by just running a simple test where as I increased the brightness on the soft LEDs I decreased the brightness on the hard LEDs. I kept the total at 217 (out of 255) on the PWM pins for the Arduino. This value was chosen because 217 is just below the cut off where the BuckBlock LED drivers start to flicker as they dim past this (0 is fully on at 1 amp, and 255 is fully off). I made exposures through a step wedge to arrive at this curve:
From this curve I reprogrammed the default paper curve in the Arduino code. This was done by looking up the grade I wanted on the vertical axis and finding the correct light ratio. I then reran the test strips at:
55 (Grade 4.x, as high as it goes on my paper and developer)
65 (Top of Grade 4)
80 (Top of Grade 3)
100 (Grade 2)
120 (Grade 1)
140 (Top of grade 0)
160 (Grade 0)
I could have run a strip at 180, but I never print this low and the Ilford MGIV has a really lumpy curve at this point, so I don’t really plan on using it. I would reduce my negative or change paper developers before printing with pure green light.

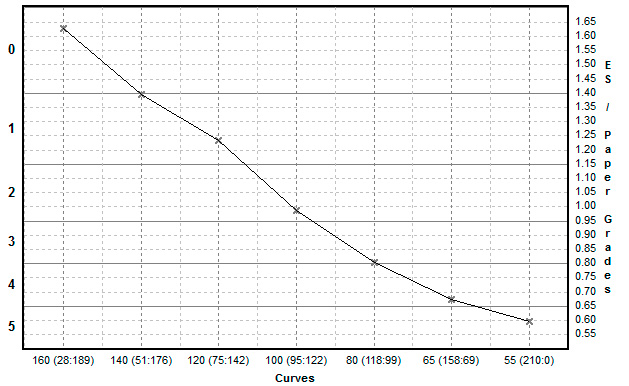
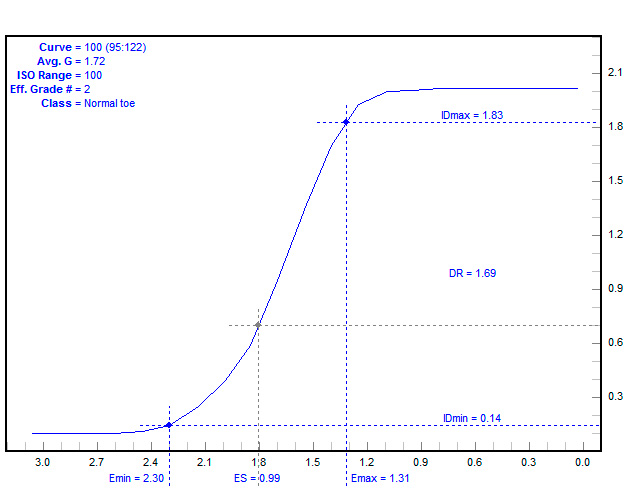
Once these curves were put in BZTS Plotter I got this graph which shows that the system is working pretty well. I could tweak things to make it more linear, but it tracks better than any other head I have used. Now I should know easily how much contrast I will get out of any change, and by reading the negative should be able to zero in on a decent starting contrast easily. Once the system is packaged up I’ll make more accurate curves for each paper I plan to use. That will let me switch papers easily since an ES of 100 should print with the same contrast on both papers (of course there will be visible differences, but the overall contrast should be the same).
The chart shows the input grade on the bottom axis, and the calculated grade on the vertical axis in both ISO Exposure Scale and traditional paper grades.
Currently I have the system setup to allow changes in 5 ES increments. This seems like a good compromise between precision and keeping the system easy to profile. I’m also not sure if a 1 ES change would even be noticeable, or repeatable between exposures.
Next I will solder up a prototype board. I’ll test it an then decide if I need any changes before committing to designing and ordering a few printed circuit boards.


